
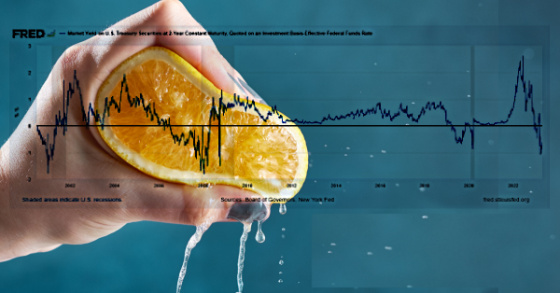
As this chart shows, the yield continues to invert with 3-month Treasury Bill yields substantially higher than 10-year Treasury Note yields.
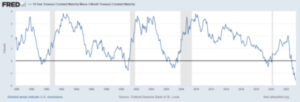
As I wrote about previously, Fed Chairman Jay Powell discounted traditional yield curve indicators such as the differential between 10s and 3-month T Bills and 10s and 2-year Treasury yields. He found research done by the Fed showing that the Near Term Forward Spread had a much better forecasting record of future economic activity and Fed policy to be quite persuasive. This is the difference between the market’s forecast for the 3-month T Bill yield 18 months from now and the current T Bill yield. When the value is positive, then the market is assigning a higher probability of short-term rates being higher in the future, and when it’s negative, that rates will be lower in the future. Right now, the spread is the most negative it’s been in over 40 years. READ FULL ARTICLE